Time Series
Two reshapes over a time column, both available in the GUI, on the command line and through MCP. All three surfaces build the same DuckDB SQL from the same builders, so a result you get in the app is the result you get in a script.
- Time buckets (resampling): group rows into one bucket per minute, hour, day, week, month, quarter or year and aggregate the values. Daily orders into monthly totals.
- Rolling window: add a column holding the aggregate of the last N rows in a chosen order. A 7-day moving average.
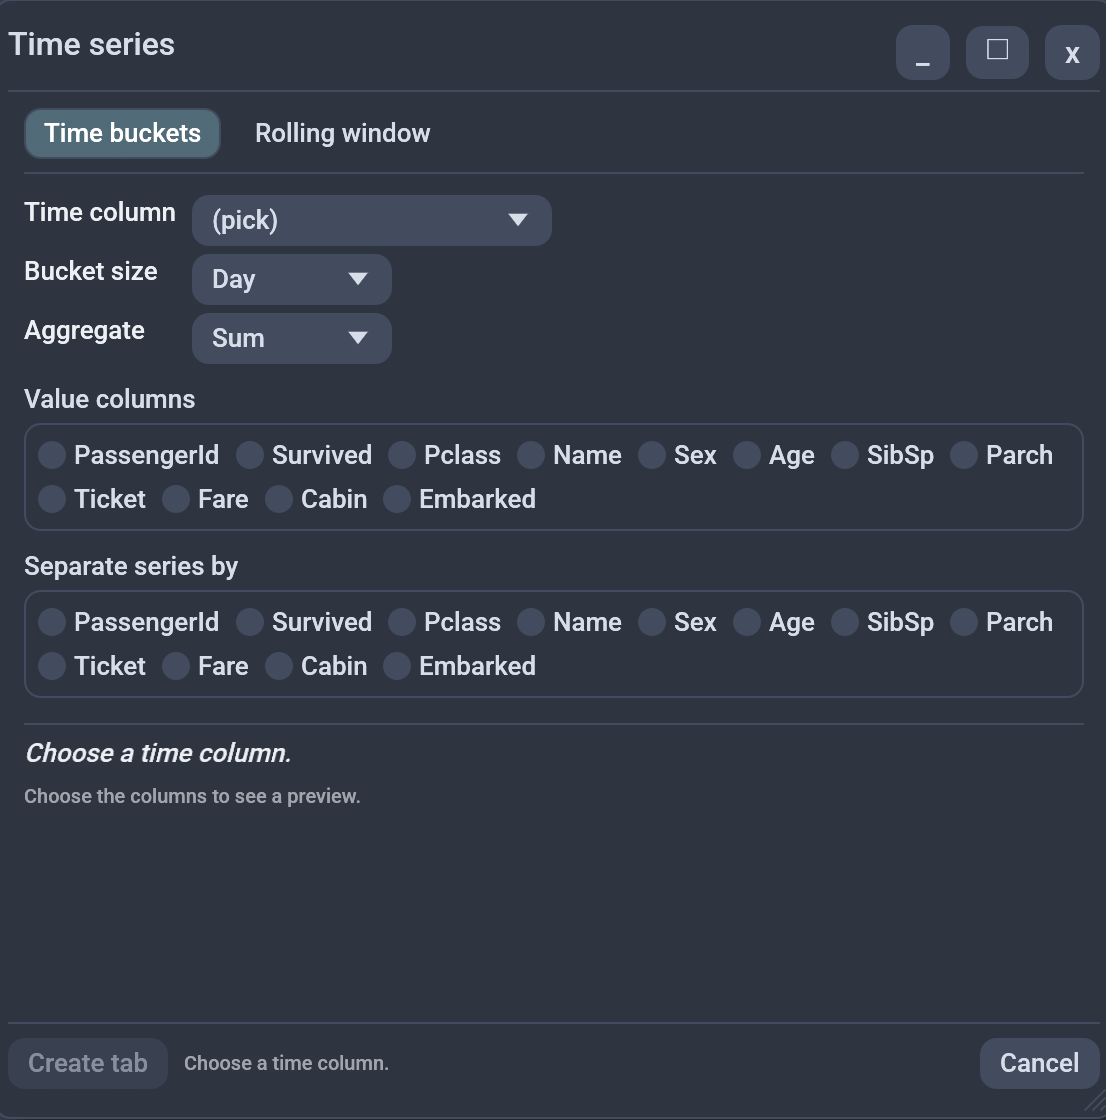
In the GUI
Analyse → Time series... The dialog has both modes behind a toggle at the top. The result opens in a new tab; the source table is never modified.
The time-column dropdown lists date- and timestamp-typed columns first, so it opens on something plausible rather than on column 0.
As you pick columns, two things update:
- A plain-language sentence describing what will happen, for example "Group the rows into one bucket per month of "ts", then take the sum of "amount"."
- A bounded preview: the operation run against the first 1000 rows, showing the first 10 results. It never runs against the full table, and it recomputes only when an input changes.
Create tab stays disabled until the inputs are usable, and the note beside it says exactly what is missing ("Choose a time column.").
Time buckets
| Field | Meaning |
|---|---|
| Time column | The timestamp column to bucket |
| Bucket size | Minute, Hour, Day, Week, Month, Quarter, Year |
| Aggregate | Sum, Mean, Minimum, Maximum, Count, First, Last |
| Value columns | The columns aggregated within each bucket |
| Separate series by | Optional. One series per combination of these columns |
The bucket lands in a column named bucket. If your table already has a
column called bucket, the new one is named bucket_2 instead.
First and Last take the value at the earliest and latest time in each bucket (rows without a value are skipped), whatever order the rows are in.
On a database tab that holds only part of its table, both modes run on the database; see Analyses on live databases.
Rolling window
| Field | Meaning |
|---|---|
| Order by | The column that orders the frame. Required |
| Value column | The column aggregated over the frame |
| Window (rows) | Rows in the frame, including the current one |
| Aggregate | As above. Defaults to Mean |
| Restart for each | Optional. The window never spans two groups |
The result is every source column plus one named
<value column>_rolling_<window>, so a 3-row mean of amount adds
amount_rolling_3.
The ordering column is mandatory and there is no way to omit it: a rolling average over unordered rows is meaningless, so the option does not exist rather than existing and misleading you.
Command line
# Monthly totals
octa --resample day --interval month --value-cols amount sales.csv

# Weekly means, one series per region
octa --resample ts --interval week --agg mean --value-cols amount,qty \
     --group-by region sales.parquet

# 7-row moving average
octa --rolling amount --order-by day --window 7 --agg mean sales.csv

# ...restarting per region
octa --rolling amount --order-by day --window 7 \
     --partition-by-cols region sales.csv
| Flag | For | Notes |
|---|---|---|
--resample COL |
buckets | The timestamp column |
--interval UNIT |
buckets | minute/hour/day/week/month/quarter/year. Default day |
--value-cols COLS |
buckets | Comma-separated. Required |
--group-by COLS |
buckets | Comma-separated. One series per combination |
--rolling COL |
window | The column aggregated |
--order-by COL |
window | Required |
--window N |
window | Required. Frame size including the current row |
--partition-by-cols COLS |
window | Restarts the frame |
--agg FN |
both | sum/mean/min/max/count/first/last |
Missing companion flags are errors, not silent defaults: --rolling
without --order-by exits 1 and names the flag.
--partition-by-cols is spelled that way because
--partition-by is the split-a-file-into-many
action. Different job, similar word.
Both honour the global -f / --format switch and
--rows.
- Command line:
--resample/--rolling
MCP and the assistant
Two read-only tools, kept under --mcp-read-only since they write
nothing:
resample_timeseries—time_col,value_cols,interval,agg,group_by.rolling_window—order_col,value_col,window,agg,partition_by.
Both take either a file path or an open_tab, accept limit and
unlimited like every other result-bearing tool, and return the table
as {schema, rows, row_count, ...}.
A note on unparseable timestamps
Bucketing casts the time column with TRY_CAST, not CAST. One
malformed timestamp in a text column puts that row in a null bucket
instead of failing the whole query, so a single bad row cannot cost you
the whole report. If you would rather find those rows than group them,
the clean-up panel or a
SQL query will show them.
See also
- Pivot / Unpivot reshapes between long and wide form and shares this dialog's preview machinery.
- Chart plots the result; a resampled table is usually a far better line chart than the raw rows.
- SQL Panel if you want the query itself rather than a dialog.