SQL Panel
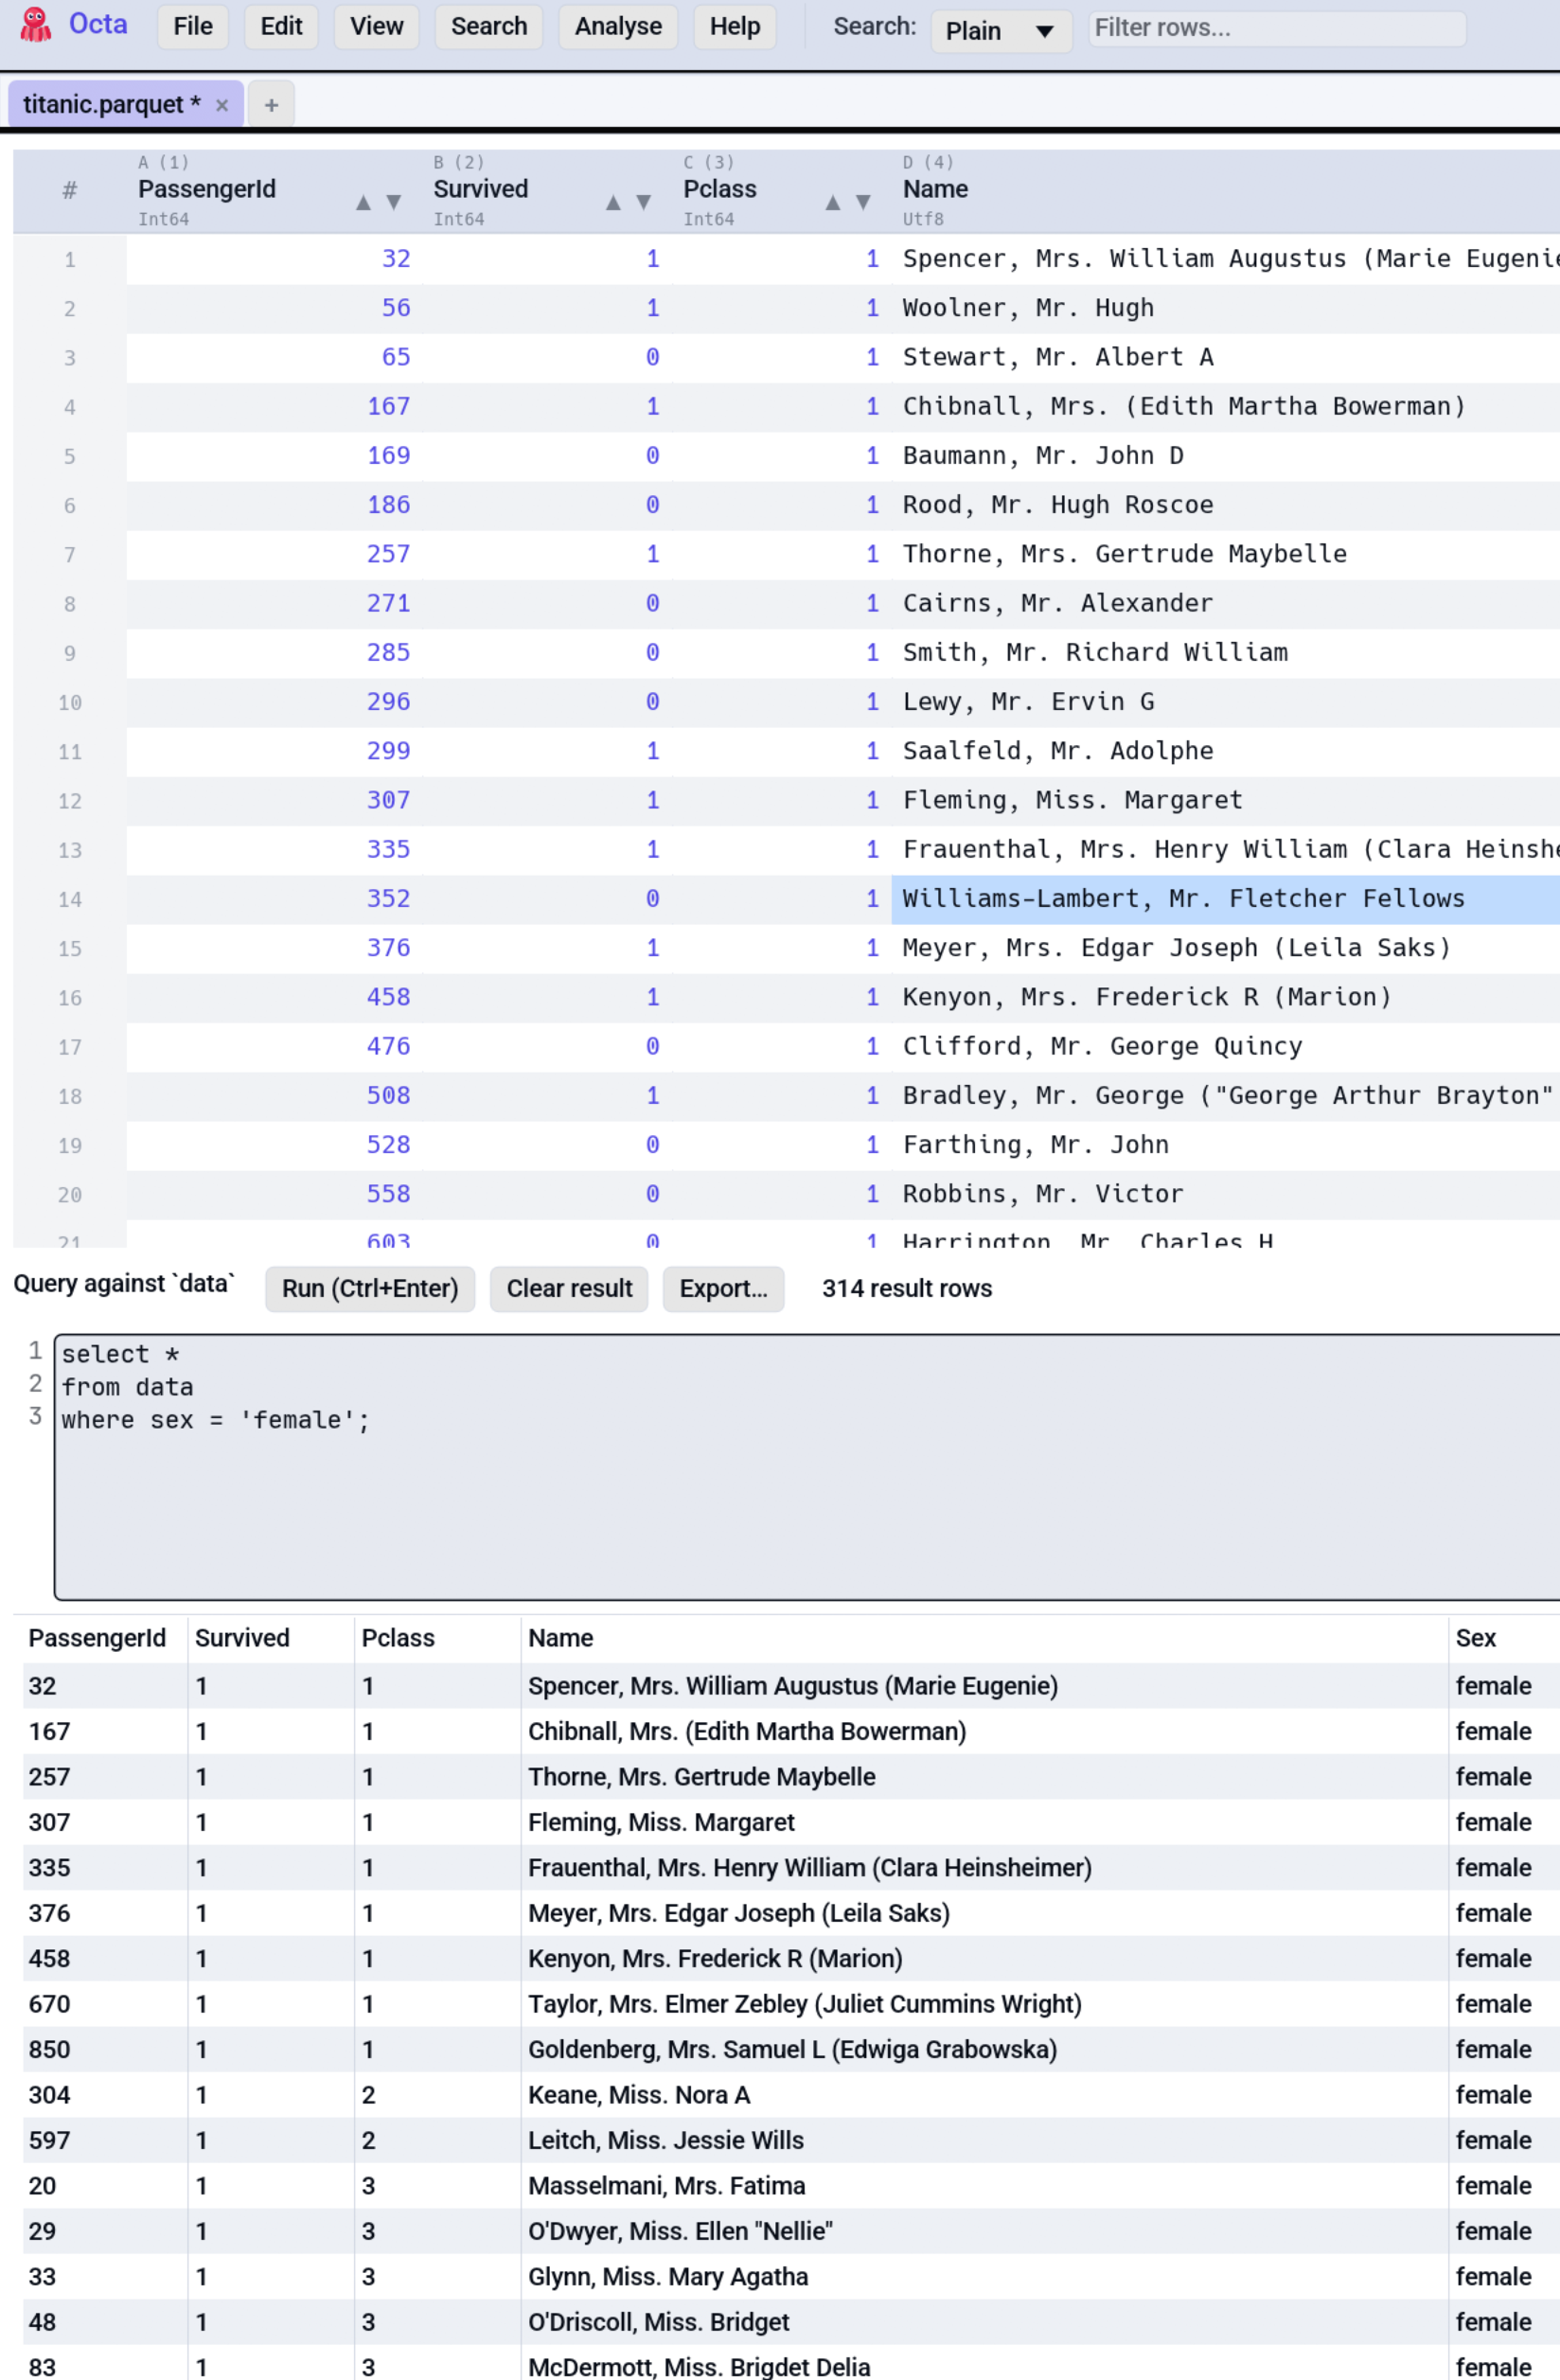
Every tabular file you open in Octa is queryable via SQL. The active
table is exposed to an in-memory DuckDB connection as a table
called data. Press Ctrl+Enter in the editor and your query runs
against the loaded rows.
Opening the SQL panel
Four ways:
- Analyse → SQL in the toolbar (visible when the active tab is on a tabular file in Table view).
- The
ToggleSqlPanelshortcut (default Ctrl+J). - New SQL editor (default Ctrl+T) opens the panel when it is closed, and another editor when it is open.
- Auto-open on file load via Settings → SQL → Open SQL panel by default.
The panel docks to the bottom by default. Change the side under Settings → SQL → Panel position (Bottom, Top, Left, or Right). The SQL panel is independent of the Chart tab; the Analyse menu also opens a chart in a new tab, and the two features can be used together.
Maximise and keep open
Maximise in the panel header lets the panel fill the window; Restore docks it again. Opened on an empty tab (no file yet) the panel starts maximised, since there is no table for it to sit beside. Opening a file into that tab docks it.
The editor stays open when you close its tab or open a file into it. The tab that becomes active opens the editor and, when its own editors are empty, takes over your editors with their files, so closing the last tab does not throw away an unsaved query. Switch this off under Settings → SQL → Keep the SQL editor open; the editor then belongs to its tab and closes with it.
Inside the panel, the workspace tree, the Inspector, the editor and the results are stacked panes sharing the panel's height. Drag the line between any two of them to move the boundary: the space comes from the pane next to it, the others stay where they are, and nothing is ever drawn over anything else. Drag the panel's outer edge to give all of them more room at once.
Writing a query
The editor is a multi-line TextEdit with:
- Line numbers in a left gutter (greyed out, monospace).
- Monospace code throughout, defaulting to JetBrains Mono bundled with Octa. Switch to system monospace or match-UI font under Settings → SQL → Editor font.
- Right-click menu for Copy
- Faded comments: everything after
--on a line is drawn faded, so what runs stands out from what does not. A--inside a quoted string is text, not a comment. - Comment / uncomment with F12: mark one or more lines (or just put
the caret on one) and press F12. Each marked line gets
--in front of its first character; if every marked line already starts with--(leading blanks ignored), that first--is removed instead, so pressing twice gets you back. With a mix, everything is commented. Blank lines are left alone, and only the first--goes, so-- -- xbecomes-- x. A--after code (SELECT a -- note) does not count, unless the selection lies only inside that comment: then just that--is removed. Rebind it under Settings -> Shortcuts.
Formatting a query
Format in the toolbar lays the query out one clause per line, indented, so a long one-liner pasted from a log becomes readable:
SELECT
    c.name,
    count(*) AS orders
FROM
    customers c
    JOIN orders o ON o.customer_id = c.id
GROUP BY
    c.name
With part of the editor marked, only that part is formatted; otherwise
the whole editor is. Comments are kept, and only whitespace, keyword case
and comma placement change, so the query means the same afterwards.
When Run on points at a SQL Server connection, [bracketed names]
are kept whole.
The style is yours to choose under
Settings -> SQL, with a live preview:
keywords in upper case, lower case or as written, indentation of 2
spaces, 4 spaces or a tab, commas at the end of a line or at the start
of the next (, b), JOIN level with FROM or indented under it, how
long a list may be and still stay on one line, how long a clause may be
and stay on its keyword's line (GROUP BY c.name), how long a bracket
may be and stay on one line (coalesce(a, 0)), how many blank lines
separate two statements, and whether the text ends with a semicolon.
Whole query on one line only tidies spacing and keyword case and
breaks nothing, for pasting into a log or a program. Format SQL can also be put on a key under
Settings -> Shortcuts.
Autocomplete
While you type a word, Octa shows a row of chip-style suggestions
beneath the editor, listing matching column names, table, schema and
catalog names, and SQL keywords. The list belongs to typing: moving the
caret any other way (a click, the arrow keys, Home or End) closes it, and
it never opens for marked text, so marking a column name and pressing
Enter or Tab does what it does anywhere else. Each part of
a dotted name completes on its own, so wh.sales.orders completes at
wh, at sales and at orders. On a tab opened from a live database
connection and running on the server, the server's catalogs, schemas
and tables are offered as well: the tab's own catalog and schema are
listed in the background when the panel opens, and anything you have
expanded in the Databases sidebar joins them. The same works on any tab
whose Run on points at a connection. Typing sales. lists that
schema's tables, and every server table the query names has its columns
fetched once in the background, so SELECT o. offers the columns of
orders a moment after you wrote FROM sales.orders o. Column names
with accents or umlauts complete like any other. The list scrolls when
more names match than fit. Click a chip to insert, or drive the popup from
the keyboard: Up / Down move the highlight, Enter or Tab
accept the highlighted suggestion, Esc closes the list and leaves the
caret where it is, so the next Enter is a line break. These keys are
only intercepted while the popup is open, so with no suggestions
showing Enter and the arrows behave normally, and Esc leaves the editor. Disable under
Settings → SQL → Autocomplete.
The editor also takes keyboard focus the moment the panel opens, so you
can start typing immediately without clicking into it first. The faded
line an empty editor shows (SELECT * FROM data LIMIT 1000, or the
server table on a database tab) is a template: press Tab and it
becomes real text, ready for Ctrl+Enter.
Running a query
- Ctrl+Enter runs the entire query.
- Mark part of the editor and Ctrl+Enter runs only the marked part. Keep several statements in one editor and run them one at a time.
- A Run button in the toolbar does the same as Ctrl+Enter, marked part included.
- A Clear button empties the editor.
- Run on picks where the query runs: local DuckDB (the workspace below), or any saved database connection. Picking a connection sends the query straight to that server in its own SQL dialect, where every table is queryable by its real name. Nothing is attached or copied, so this is the fast way to query a database from an empty SQL editor. A tab opened from a database starts on its own connection. Attach connection (below) is still there for the one thing direct mode cannot do: joining a server's tables with local files.
- While a query runs, the result area shows a spinner and how long
it has been running, in place of the previous result. A query on a
server, or on the local DuckDB, can be cancelled right there, and Run
turns into Cancel in the toolbar meanwhile. The window keeps
responding while either runs. A statement that changes
data(UPDATE, DELETE, INSERT) keeps the tab read-only until its result is folded back; a plain SELECT leaves the tab alone.
Several editors side by side
+ in the toolbar (or Ctrl+T, also while typing) opens another editor next to the others, each with its own query and its own result underneath. Click into an editor (or its result) to make it the active one: Run, Ctrl+Enter, Format, History, Export and Open result as tab all act on it, and it gets a thin outline. The small × above an editor closes it and its result; the last one stays. The workspace, Run on and Ask are shared by all of them.
Copying from the result
Click a cell to select it. Ctrl+click adds or removes more cells, Shift+click adds the rectangle from the last clicked cell, a column header selects the whole column and a row number the whole row (Ctrl+click adds more of either). Ctrl+C copies the selection as tab-separated text, one line per row, ready to paste into a spreadsheet. Right-click a cell for Copy cell, Copy row, Copy column, Copy selection and Copy all.
Each tab owns a persistent DuckDB workspace: added tables and attached databases survive across runs and are dropped when the tab closes. See The workspace below.
The workspace
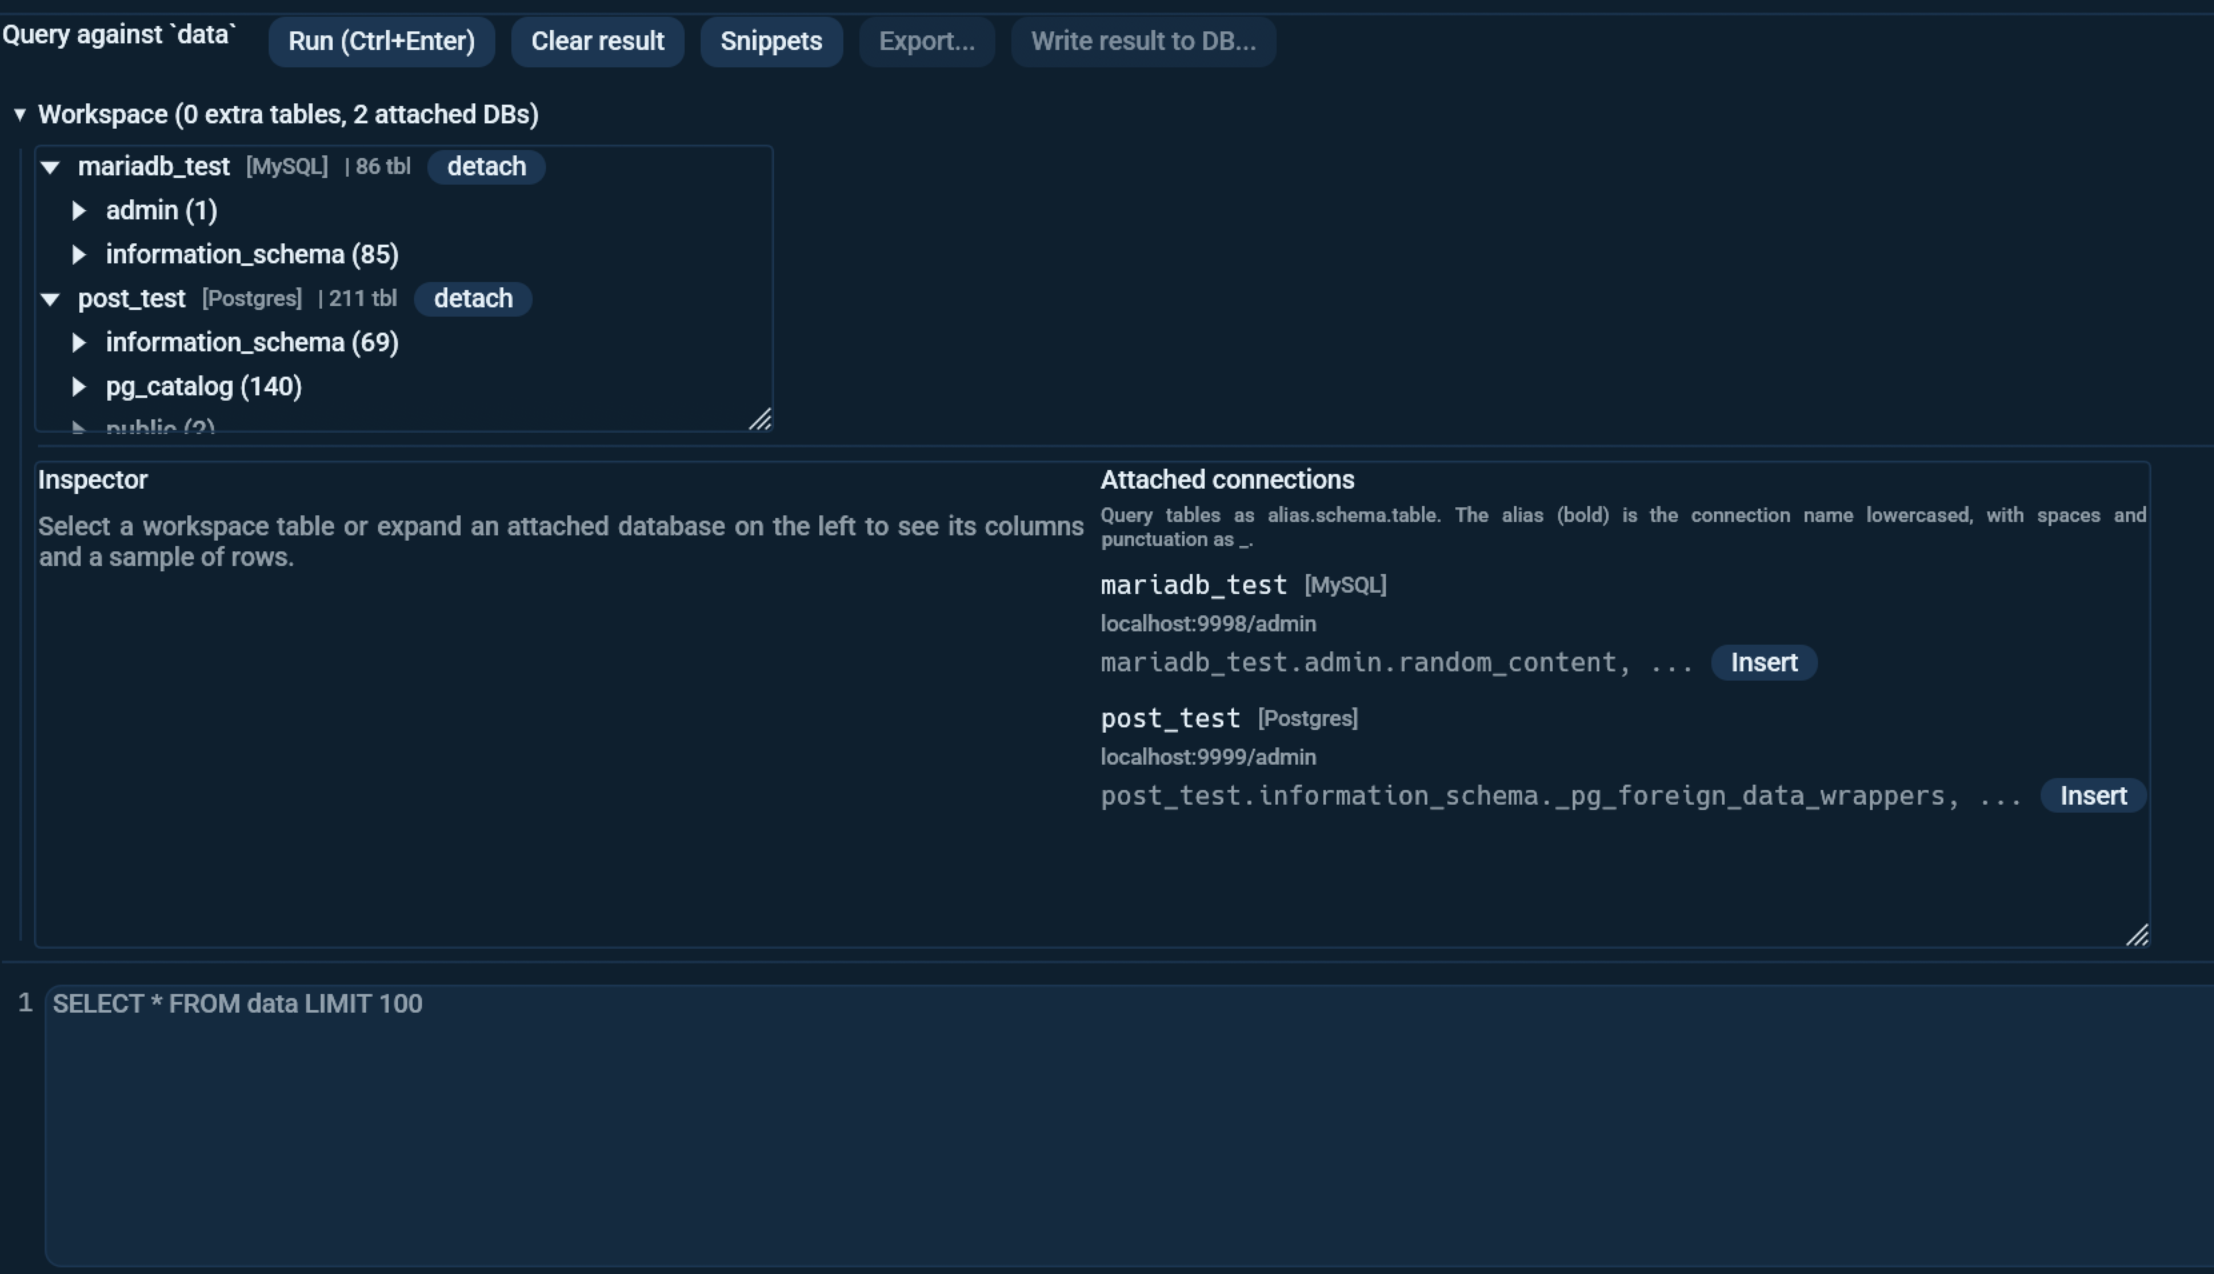
The collapsible Workspace section above the editor lists everything your queries can reach:
data- the active table, unsaved edits included. Octa copies it into DuckDB in the background when the panel opens and again at the first Run after the table changes, so querying an unchanged table again costs no copy. refresh next todatacopies it at once. The status bar says when a copy is running, and the tab is read-only until it is done, about a second per million rows; a Run started meanwhile waits for it. On a large-file tab,datais the whole file instead, scanned where it lies, not the page on screen: acount(*)counts every row of it.- Your other open tabs, each under a SQL-safe version of its own tab name. Nothing to set up: open two files and join them by name. The panel says once which names it registered, and the note can be dismissed. Switch it off under Settings -> SQL -> Query other open tabs. The copy runs in the background, and the status bar says so while it does. Tabs above Max rows to register (200,000 by default) are left out, because registering a tab copies its rows into DuckDB.
- Tabs from a live database connection are deliberately not copied. When the query runs on the server, every table on that server is already reachable by its real name, so a join between two tables of the same database happens where the data lives rather than after copying both into DuckDB. The panel says so above the workspace list.
- + Add table... loads additional files (any readable format) as extra tables for cross-file JOINs. The files are read in the background: the status bar counts them, and its Cancel stops between two files and takes back the ones already added. Cloud objects picked with Attach cloud are added the same way.
- Attach database... ATTACHes a DuckDB or SQLite file; its inner
tables are addressed as
alias.schema.table. It runs in the background. If the SQLite add-on cannot be loaded, every table is copied instead (asalias__table); the status bar's Cancel stops that copy and takes back what it made. - Attach connection ATTACHes a saved
live database connection read-only
(PostgreSQL / MySQL natively via DuckDB extensions; SQL Server,
Oracle and the warehouses have no DuckDB extension, so their tables
are imported as plain workspace tables, and their menu entry opens
into the tree so you can pick how much to import: see Picking what
to attach). For a native ATTACH the
alias you use in SQL is
the connection name lowercased with spaces and punctuation as
_("Post-Test" becomespost_test). You never have to guess it: the Attached connections box next to the Inspector lists every alias with a one-click example query, and clicking any attached table in the tree offers Copy / Insert / Run for its qualified name. - Attach cloud picks objects out of a saved cloud connection and registers each as a workspace table. See Cloud objects as workspace tables below.
Picking what to attach
PostgreSQL, MySQL and Redshift attach natively: one click takes the
whole server, nothing is copied, and every table stays queryable as
alias.schema.table.
Every other engine (SQL Server, Oracle, ClickHouse, Exasol, Snowflake, Databricks, BigQuery, Trino) has no DuckDB extension, so an attach fetches the tables it covers. Their entry under Attach connection therefore opens into the server's tree instead of attaching straight away, and you say how much you want:
- a single table - the fastest and the usual answer,
- a schema, which brings in the tables under it, or
- Attach everything here, which takes the whole level you are standing on.
Trino, Snowflake, Databricks and BigQuery put a catalog above the schema, so their tree starts one level higher: catalog, then schema, then table. "The schemas of this server" is not a question those engines can answer, so their root has no Attach everything here; pick a catalog first.
An imported table is named after itself: pick orders out of a
Databricks catalog and you write SELECT * FROM orders. It joins the
workspace as an ordinary table (not as an attachment, since nothing
stays connected once the rows are copied), and where it came from is on
the row: hover it to see warehouse main.sales.orders. A name the
workspace already uses takes a _2 suffix.
Double-click a table's name to rename it, so a FROM clause says
whatever you want it to. Names are lowercased with spaces and
punctuation turned into _, the same as everywhere else in the
workspace, and a name another table holds is refused rather than
silently overwriting it. data is the one name you cannot change: the
refresh button and the edit path both address the active tab by it.
An import takes any number of tables. It runs in the background: the status bar counts the tables done, and its Cancel stops the import. It is all or nothing: a cancelled or failed import takes back the tables it already brought in, so no table is ever silently left out of an attachment. Each table holds at most the maximum rows loaded on open setting; for more, query the server directly with Run on server.
Cloud objects as workspace tables
Attach cloud lists your saved cloud connections and opens a picker on the one you choose. Browse the folders, tick the objects you want, and Add to workspace downloads each and registers it as a table named after the file. Only files a reader can open are offered, so you cannot tick something that would fail on download.
Ticking several objects gives you several tables. Combine the picked objects into one table unions them into a single table instead, and it starts off on purpose: a union reconciles differing schemas, and Octa does not do that to your data unless you ask. A column missing from one file comes back empty for that file's rows, exactly as in Union tables.
Clicking a table in the list opens it in the Inspector: columns, types, and a sample of rows.
The workspace also works with no table open at all: open the panel
via Analyse > SQL on an empty tab, attach your connections, and
query the servers directly (cross-server JOINs and UNIONs included);
there is simply no data table until you open a file.
History and snippets
The SQL toolbar has two ways to reuse queries:
-
History is a dropdown listing the queries you have actually run, most recent first, each with where it ran (the connection, the cloud object or the file), how long it took and how many rows it returned. Hover an entry to see the whole query with its line breaks and when it ran. Pick one to add it below what the editor already holds; it comes in marked, so Run runs just that query (where the query runs stays as it is). Use Clear history at the bottom to forget the lot.
History is one list, kept between sessions: every SQL editor, whatever tab or connection, shows the same queries. It lives in
sql_history.jsonin the config directory; a file written by an earlier version, which kept one list per connection, is merged into the single list on first start.Settings -> SQL -> Query history controls it: Keep the queries I run is on by default and keeps the last 20 in total (0 keeps them all). Turning it off stops recording and deletes what was kept, because a query can carry values out of your data and a switch that leaves the old file behind would be a poor kind of off. Re-running a query moves it back to the top rather than adding a second copy. A picked query replaces the editor text (off by default) makes a query picked here or inserted from Snippets replace what the editor holds instead. - Snippets opens a manager window for a persistent, named library of queries. Save current query as snippet... stores the editor content under a name and an optional description; each saved snippet has Insert (add it below the editor text, marked so Run runs just that query, the same as History) and x (delete). The window has the usual minimise / maximise / close controls and is resizable. Snippets are stored in
sql_snippets.jsonin the config directory, so they survive restarts and are shared across all tabs.
Saving and opening SQL files
The File button in the SQL toolbar reads and writes plain .sql files,
so a query can live next to your project rather than only inside Octa.
- Open... reads a
.sqlfile. An empty editor takes it; an editor that already holds text keeps it, and the file opens as a new editor after the others (appended at the right). A file bigger than the text size limit (Settings -> Performance -> Raw view size cap) is refused with a message. - Save writes the editor back to the file it came from. An editor that has no file yet asks where to save it, the same as Save as.... Ctrl+S does the same while you are typing in the editor; anywhere else it still saves the table.
- Save as... writes the query to a new file, which the editor keeps from then on.
An editor with a file shows its name above the text (with the editor number
in front when there are several), followed by * while the text differs
from what is on disk. Hover the name for the full path. Saving writes to a
temporary file first, so a failed save leaves the old file intact; a read or
write error shows in the result area of that editor. Octa does not ask about
unsaved changes when you close an editor, a tab or the app, and does not
reopen the files in the next session, so save first if you want to keep
them. A file keeps its line endings: one written on Windows with CRLF is
saved with CRLF again.
With Keep earlier versions on, Save keeps the file it replaces like any other save.
Open SQL file... and Save SQL file as... can be given a key under Settings -> Shortcuts; they ship without one.
Ask
Under the toolbar there is an Ask box, on a row of its own with the Ask button and the assistant picker. Type what you want in plain words ("revenue per country, biggest first") and Octa writes the SQL into the editor at your cursor. The rest of the editor is left alone, so you can ask for one piece of a query you are already writing.
The box starts one line tall and grows as you type, so a long question stays readable instead of scrolling sideways out of sight. Enter sends the question and Shift+Enter starts a new line.
Beside the box, a dropdown picks which assistant answers, the same control the search bar's Ask has. It is per tab and starts on whatever the chat panel is set to, so you can send one question to a bigger model without changing the panel. It only appears when more than one profile is configured, since with one there is no choice to make.
The query is never run for you. Read it, change it if you like, then
press Run. Only a single SELECT is ever produced: a reply containing a
second statement, or anything that is not a SELECT (or a leading WITH),
is rejected and nothing is inserted.
Ask sends the active table's column names, their types and the row count to the chat profile configured under Settings > Chat / Assistant. It does not send the data itself.
It also sends the workspace: every table registered from another tab and every attachment's tables, with their columns, so it can write a join across them and call each one by its real name. The list is capped at 12 tables and 40 columns apiece to keep the request small; attachment tables come from the cached listing, so no extra query goes to the server.
When the panel is set to run on a server, the query is written in that
database's dialect against the real schema.table name instead of
data, and the row count is the table's own, not the size of the page
currently on screen.
Ask is greyed out when no chat profile is set up, or when there is nothing for the prompt to describe: no columns on the tab and no registered or attached workspace tables. An empty tab with a database attached is therefore fine, which is exactly the tab the panel exists for. Hover it to see which case applies.
What's available
DuckDB's full SQL surface, including:
- Window functions:
ROW_NUMBER(),RANK(),LAG(), etc. - Aggregations:
SUM,AVG,COUNT,MEDIAN, percentiles, etc. - JSON functions:
json_extract,unnest, … - Date/time functions, string functions, regex functions.
- CTEs (
WITH ... AS (...)), subqueries, correlated subqueries. PIVOT/UNPIVOT.DESCRIBE datato see the column types DuckDB sees.
The placeholder query shown when the editor is empty is
SELECT * FROM data LIMIT {settings_default} (the default row
limit is configurable under
Settings → SQL → Default row limit).
This is only a hint; your editor field is actually empty, so type to
replace.
Result rendering
Results render in a table below the editor, with a row counter
directly above the grid, followed by how long the query took in
brackets (1234 result rows (84 ms), switching to seconds past one
second). The timing covers the query itself, and for a query run on a
live connection it covers the round trip to the server. A query that
fails is timed too, so a slow statement that ends in an error still
tells you where the minute went. The counter is display-only: it is
never a column of the result and never lands in an export. The result table is a
separate egui_extras::TableBuilder from the main
Table view (no edit overlay, no row selection
beyond click-to-select-text).
Results arrive one page at a time. A SELECT is computed once inside
DuckDB and the first
Result rows per page rows (1,000 by
default) are handed to the grid; scrolling near the end fetches the next
page. The row counter shows both numbers, 1,000 / 8,432,109 result
rows, and that total is an exact count(*) over the whole result, not
"we stopped counting here". Set the page size to 0 to load every row at
once.
Paging is a display decision only. Export and Write result to DB always read the whole result, not the page on screen.
Queries run on a live database connection are not paged: they honour the initial-load row cap as before (Settings → Performance, default 2,000,000), and the row counter says so when a result stops there ("row cap reached, result truncated"). Raise the cap, or narrow the query, to see more.
Errors render in red below the editor.
CREATE TABLE opens a new tab
A CREATE TABLE or CREATE VIEW statement turns into a new tab named
after the table, with the declared columns and types:
gives an empty grid to type into, and
gives a tab holding those rows. Either way the tab you ran it from is untouched, so this works from an empty tab with nothing open (the SQL panel opens there too), and it is not blocked by read-only mode: a new tab is not an edit. Save the new tab like any other table.
The table is handed over rather than kept: after the statement, people
is no longer queryable from the original panel. Switch to the new tab and
it is data there. CREATE OR REPLACE of a table that already exists
(data included) is an ordinary mutation of that table, and a CREATE
inside an attached database is left to that database (attachments are
read-only, so DuckDB refuses it).
On the command line, octa --sql file -q "CREATE TABLE ..." prints the
created table; the run_sql MCP tool returns it as result with
"created": "<name>".
Mutations
INSERT / UPDATE / DELETE queries run via conn.execute()
instead of conn.query(). After a mutation, Octa re-selects the
full data table and replaces the base table in the active
tab, so the mutation's effect is visible immediately.
To make the effect easy to spot, Octa briefly highlights the changed cells and any new rows in green after a mutation. Toggle this and set its duration under Settings → SQL (Highlight SQL changes / Highlight duration, on by default, 4 seconds). The highlight is a temporary display mark and clears itself.
Mutations don't persist back to disk by default
A mutation changes the in-memory table only, so it is lost when you close Octa unless you also save the file via File → Save.
For files Octa supports writing (CSV, Parquet, SQLite, …), saving after a mutation persists the change. For read-only formats (SAS, HDF5, …) the change is in-memory-only, though you can Save as to a writable format to export it.
Opening a result as a tab
Open result as tab... in the toolbar opens the whole result as a new tab of its own, named "SQL result". Every row goes in, not only the page on screen, and the tab behaves like any other table: edit it, filter it, chart it or save it. The SQL panel's own tab and its workspace stay as they were.
Exporting results
The toolbar's Export… button (and the Ctrl+Shift+E shortcut) saves the current SQL result as a separate file. The dialog accepts any writable format Octa supports: Parquet, CSV, JSON, SQLite, etc.
Examples
-- Count rows per category
SELECT category, COUNT(*) AS n
FROM data
GROUP BY category
ORDER BY n DESC;

-- First / last per user
SELECT user_id,
       MIN(timestamp) AS first_seen,
       MAX(timestamp) AS last_seen
FROM data
GROUP BY user_id;

-- Rows containing JSON
SELECT id, json_extract(payload, '$.user.email') AS email
FROM data
WHERE payload IS NOT NULL;

-- Window function: rolling 7-day count
SELECT date,
       COUNT(*) OVER (
         ORDER BY date
         RANGE BETWEEN INTERVAL 6 DAY PRECEDING AND CURRENT ROW
       ) AS rolling_7d
FROM data;

-- DESCRIBE for schema discovery
DESCRIBE data;
Limitations
- Live-database results are not paged. A query run on the server still materialises up to the initial-load row cap in one go; only local DuckDB results arrive page by page.
- No DDL persistence.
CREATE TABLE other AS SELECT ...succeeds but the new table dies with the connection on the next Ctrl+Enter. - No extensions yet. DuckDB has powerful extensions
(
spatial,postgres_scanner,sqlite_scanner, etc.), but they are not auto-loaded by the SQL panel.
For multi-file analysis the CLI's
octa --sql FILE -q 'SELECT ...' is a good
companion: it spins up a fresh DuckDB and you can layer ATTACH /
COPY however you want.
Explain a query
Explain sits beside Run. It shows how the database would carry out a
query, without running it. It takes the marked text, or the whole editor
when nothing is marked, and explains one statement at a time. Nothing is
executed (Octa never uses EXPLAIN ANALYZE), so it is safe on read-only
connections, and explaining a DELETE deletes nothing. A semicolon anywhere
but at the end is refused, even inside text or a comment, so nothing after
it can reach the database.
The plan comes in three views, and the choice is remembered per editor:
- In plain words (first): the steps numbered in the order the database works through them, with plain names, the table each step reads and the rows the database expects. Each step also says what sets it apart, in the query's own terms: the condition it keeps rows by, how many rows a limit keeps, what a group or sort goes by. A join or union says which earlier steps it combines. Steps that have no plain name (internal bookkeeping such as Spark's exchanges) are left out here; the other two views show every step.
1. Read whole table: orders, keeps rows where amount > '10'::numeric, ~993 rows
2. Read whole table: customers, ~50 rows
3. Join (hash), uses steps 1 and 2, ~993 rows
4. Group: by c.name, ~50 rows
5. Sort: by (sum(o.amount)) DESC, ~50 rows
6. Limit, ~5 rows
- Table: the same steps as rows, with depth, step, table, estimated rows, detail and server_name (the server's own name for the step).
- Server's own: the plan exactly as the server printed it, with every technical detail.
Explain works on local DuckDB, PostgreSQL, MySQL / MariaDB, Databricks and BigQuery. On other engines the button is greyed out and its hover text names the engine. On BigQuery the plan shows the bytes the query would read, never a price. Databricks plans carry no row estimates, so that column stays empty there. Databricks also filters while it reads, so the condition shows on the table read, and it groups and sorts in two rounds (each part of the data first, then all of it together), so those steps can appear twice.
On the local DuckDB, Explain does not run while a query runs or the table is still being copied into SQL; the editor says so. Press it again once that is done. When the table changed since the last Run, Explain copies it first, in the background, and shows the plan when the copy is done.
The shortcut Explain query plan ships unbound; bind it under Settings > Shortcuts.
Command line and MCP
The same job without the GUI:
- MCP:
run_sql(explain: truereturns the plan)
See also
octa --sqlis the CLI form of this panel.- Settings → SQL covers autocomplete, panel position, default row limit, and editor font.
- Search & Filter covers value-based filtering that does not need SQL.
- Chart opens the active table in a new chart tab from the same Analyse dropdown.