Value Frequency
The Value Frequency dialog answers "what are the most common values in
this column?". It is a one-click equivalent of pandas'
df['x'].value_counts() for the active table.
Opening the dialog
| Path | Notes |
|---|---|
| Right-click column header | "Value frequency…" entry in the column-header context menu. |
| Analyse menu | Analyse → Value frequency… opens a column picker first (the menu has no column context), then the dialog for the chosen column. |
| Keyboard shortcut | Ctrl+Shift+I Targets the column of the currently selected cell. With no cell selected it opens the same column picker. |
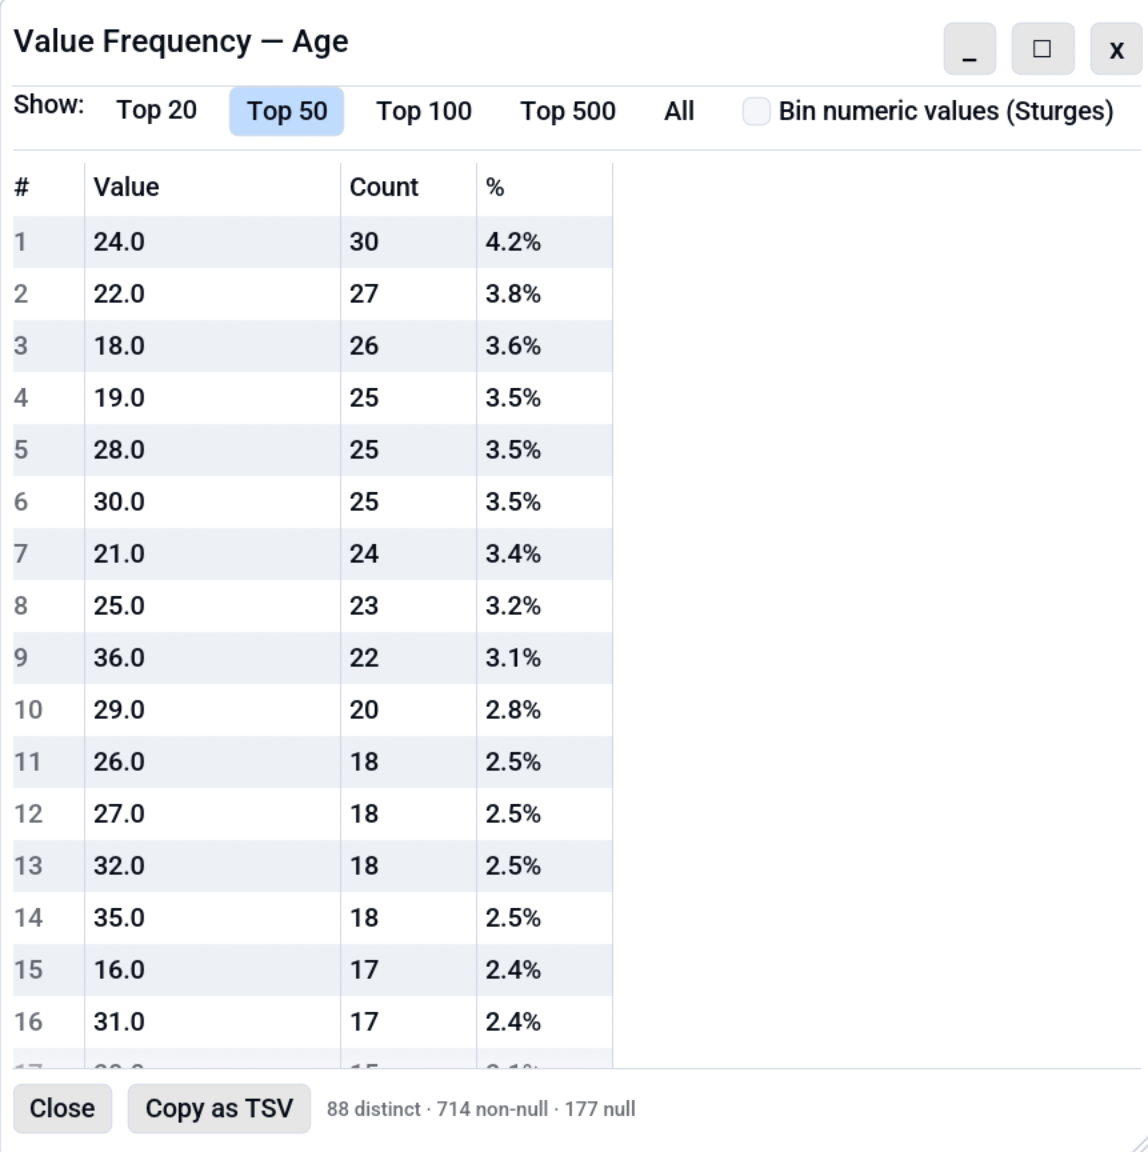
What it shows
Three columns per row:
| Column | Meaning |
|---|---|
| Value | The distinct cell value (or the range, if numeric binning is enabled). |
| Count | How many rows have this value (or fall in this bin). |
| % | count / total_non_null * 100, to one decimal place. |
For raw value counts, rows are sorted by Count descending; ties broken alphabetically by Value for a deterministic ordering. (When numeric binning is on, rows are instead shown in ascending range order.) The footer reports total distinct values, total non-null cells, and the null count for the column.
Top-N presets
| Preset | Effect |
|---|---|
| Top 20 / Top 50 / Top 100 / Top 500 | Show the N most common values. Default is Top 50. |
| All | Show every distinct value. Watch the row count on high-cardinality columns. |
The selected preset persists per tab, so reopening the dialog on the same tab remembers your choice. Top-N applies to raw value counts only and is hidden while numeric binning is on, where the bin count controls how many rows you get.
Numeric binning (histogram)
For numeric columns (Int*, Float*), check Bin numeric values
to build a histogram: instead of counting each raw value, Octa
takes the column's range [min, max], splits it into N equal-width
ranges, and counts how many rows fall into each.
Type a number into the Bins: field to set N (clamped to
[1, 1000]); leave it empty for an automatic count via Sturges' rule
(ceil(1 + log2(n)), clamped to [5, 30]).
What you see:
- N bins means N rows. Every range is shown in ascending order,
including empty ones (count
0), so the row count is always the bin count you asked for and the distribution's shape is visible. - Range labels are
[lo, hi)half-open intervals (loincluded,hiexcluded) so each row counts in exactly one bin; the last bin is closed[lo, hi]so the maximum value has a home. - The Count column is how many rows fall in that range; tall counts mark where your data clusters.
- When every value in the column is identical there's no range to split, so you get a single bucket.
Because the bin count is the control while binning, the Top-N
presets (Top 20 / 50 / … / All) are hidden; they apply only to raw
value counts. Non-finite values (NaN, ±Inf) and accidental
non-numeric cells in a numeric column appear as separate rows after the
bins, useful for catching type drift.
The checkbox is hidden for non-numeric columns. Untick it to go back to exact per-value counts.
Acting on a frequency row
Right-click any row (when binning is off) to get:
- Copy value puts the raw value on the clipboard.
- Filter table to this value adds a column filter restricting the active table to rows where this column equals the picked value. The Excel-style column-filter chip appears in the status bar; see Column Filter to clear it.
Copy as TSV
The Copy as TSV button at the bottom puts the entire visible table
on the clipboard as three tab-separated columns: <column>, count,
percent. Useful for pasting into a spreadsheet or another Octa tab
via the regular paste-into-cells path.
See also
- Summary: one row of statistics per column, for a table-wide overview.
- Search & Filter: including the column filter that Value Frequency can populate.
- Keyboard Shortcuts: to rebind Ctrl+Shift+I.