Summary
The Summary tab answers "what does this table look like?" in one click.
It is the GUI counterpart of the CLI's octa --describe and of pandas'
df.describe(): one row of statistics per column of the active table.
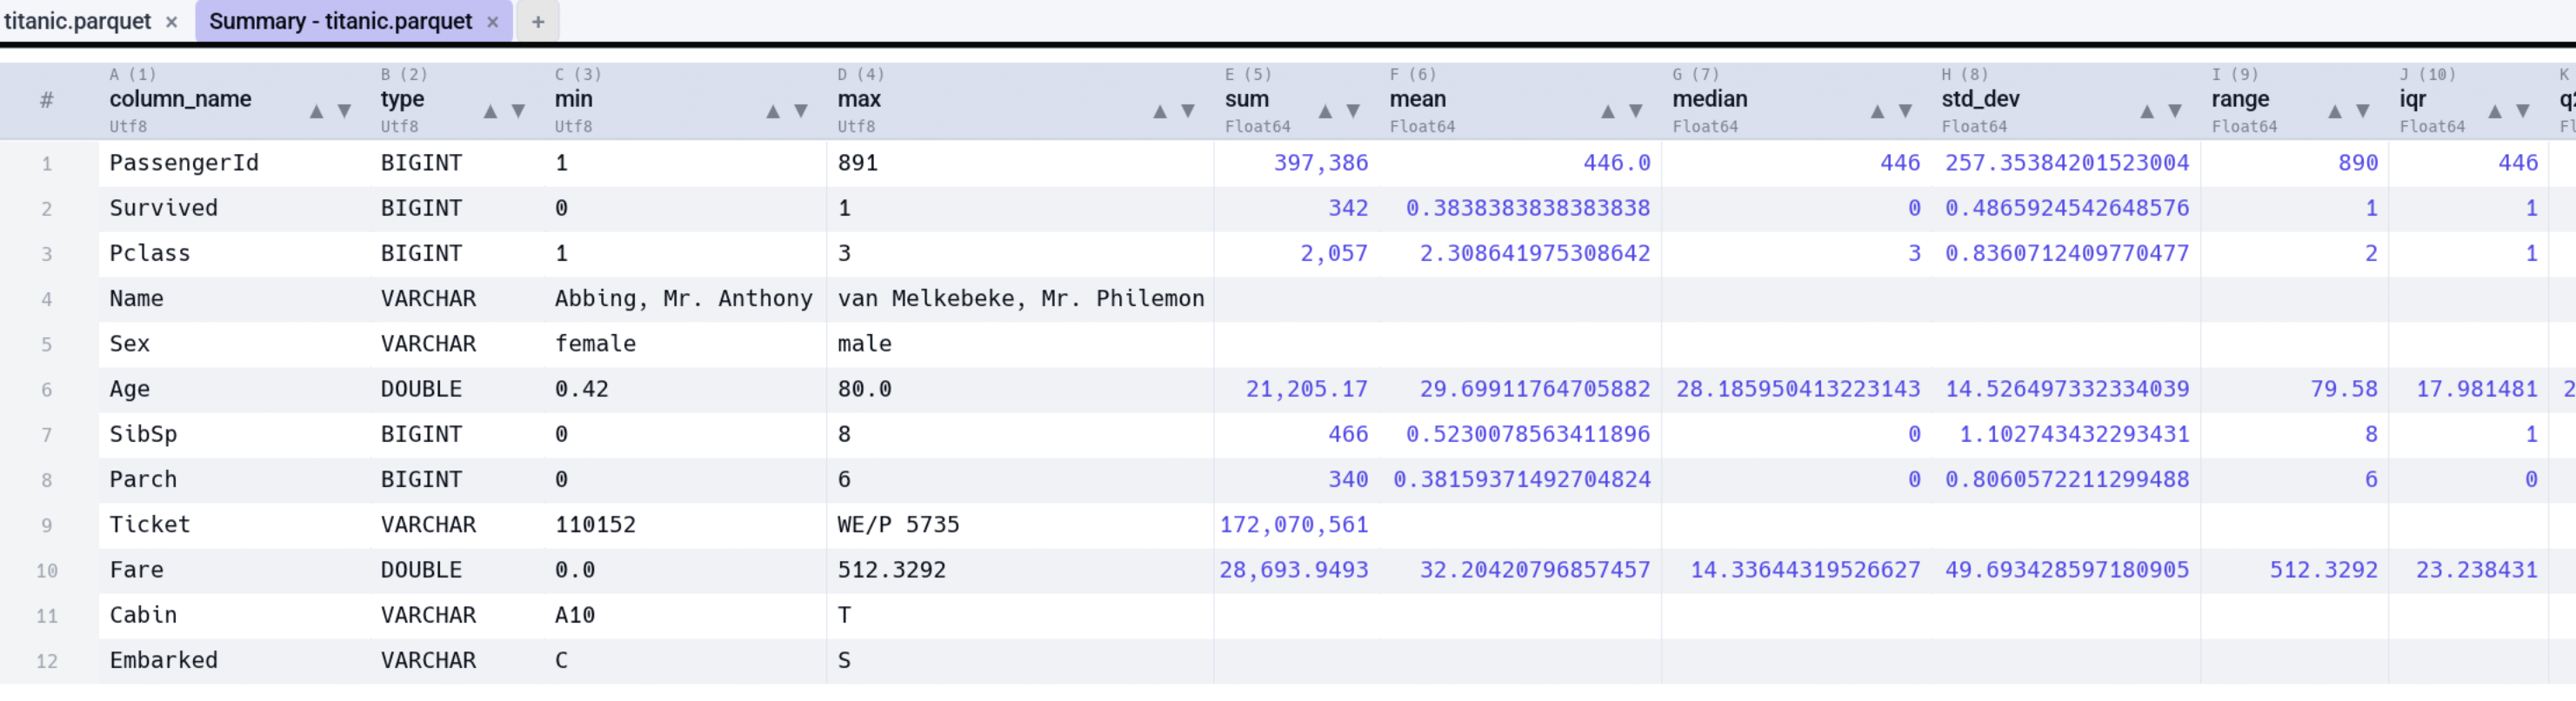
Opening it
Analyse -> Summary... opens a new tab named Summary - <file> for
the active table. Unsaved cell edits are included: the statistics
describe the table as you currently see it, not the file on disk.
What it shows
One row per source column. The column headers are short, lower-case identifiers (with underscores, no spaces) so the table is easy to reuse elsewhere; hovering a header explains what the statistic means in your chosen language. The available statistics are:
| Header | Meaning |
|---|---|
column_name |
The source column this row describes (always shown). |
type |
The data type Octa inferred for it (always shown). |
min / max |
Smallest and largest value. |
sum |
Total of the numeric values. |
mean / median |
Average and middle value (numeric columns). |
std_dev |
Standard deviation (numeric columns). |
range |
Largest minus smallest value. |
iqr |
Interquartile range (q75 minus q25). |
q25 / q75 |
Lower and upper quartiles (numeric columns). |
mode / mode_count |
Most frequent value and how often it occurs. |
not_null / null_count |
Counts of present and missing values. |
null_percent |
Share of missing values in the column. |
unique_count |
Exact count of distinct values (nulls excluded). |
distinct_ratio |
Unique values divided by total rows. |
text_len_min / text_len_max |
Shortest and longest text length in characters. |
total_rows |
Row count of the whole table. |
How Min / Max work for text
For numbers, dates, and times, Min and Max are the smallest and largest values, as you'd expect. For text columns the comparison is lexicographic (dictionary order by character code), not by length or meaning:
- It compares character by character, left to right.
- It is case-sensitive, and uppercase letters come before lowercase
ones, so
"Zebra"sorts before"apple". - Digits compare by their character, not their numeric value, so as text
"10"sorts before"9"(the character1comes before9). Numbers stored as text do not sort numerically.
This matches DuckDB's default string ordering (a plain byte / code-point
comparison with no locale collation), since the figures come from
DuckDB's SUMMARIZE. If a column should sort numerically or by date,
give it a numeric or date type (Octa's
date inference and the
SQL view's CAST can help) rather than leaving it as text.
Choosing which statistics show
Settings -> Summary has a checkbox per statistic. Turn off the ones
you don't need and the Summary tab drops those columns; column_name and
type are always present. The core figures come from a single DuckDB
SUMMARIZE pass, plus derived null counts and an exact distinct-value
count (COUNT(DISTINCT ...), so unique_count never exceeds the row
count). Switching on sum or the text-length statistics adds one extra
aggregate pass, and the mode statistics add one small pass per column,
so a minimal Summary stays a single query.
Number formatting
Numeric statistics are stored as real numbers, not text, so they follow
the same display settings as the main table and right-align like numbers.
When thousand separators are switched on (Settings -> Display),
figures like sum, total_rows, and the counts are grouped
(1,234,567), and the chosen English / European style sets the grouping
and decimal marks. A numeric column's min / max / mode group too; a
text column's stay verbatim, as do the column name and type. Because the
values stay numeric underneath, saving or exporting the Summary keeps
clean numbers (no separators baked in).
Working with the result
The Summary tab is an ordinary table tab: you can sort it, filter it, copy cells, and export it via File -> Save as. It is a detached snapshot with no source path, so it can never overwrite the original file. Re-run Analyse -> Summary... after further edits to get a fresh snapshot.
For a deeper look at a single column, use Value Frequency instead.
Command line and MCP
The same job without the GUI:
- Command line:
octa --describe - MCP:
profile