Analyse
Statistics, frequencies, time series, charts and reports from the table in front of you.
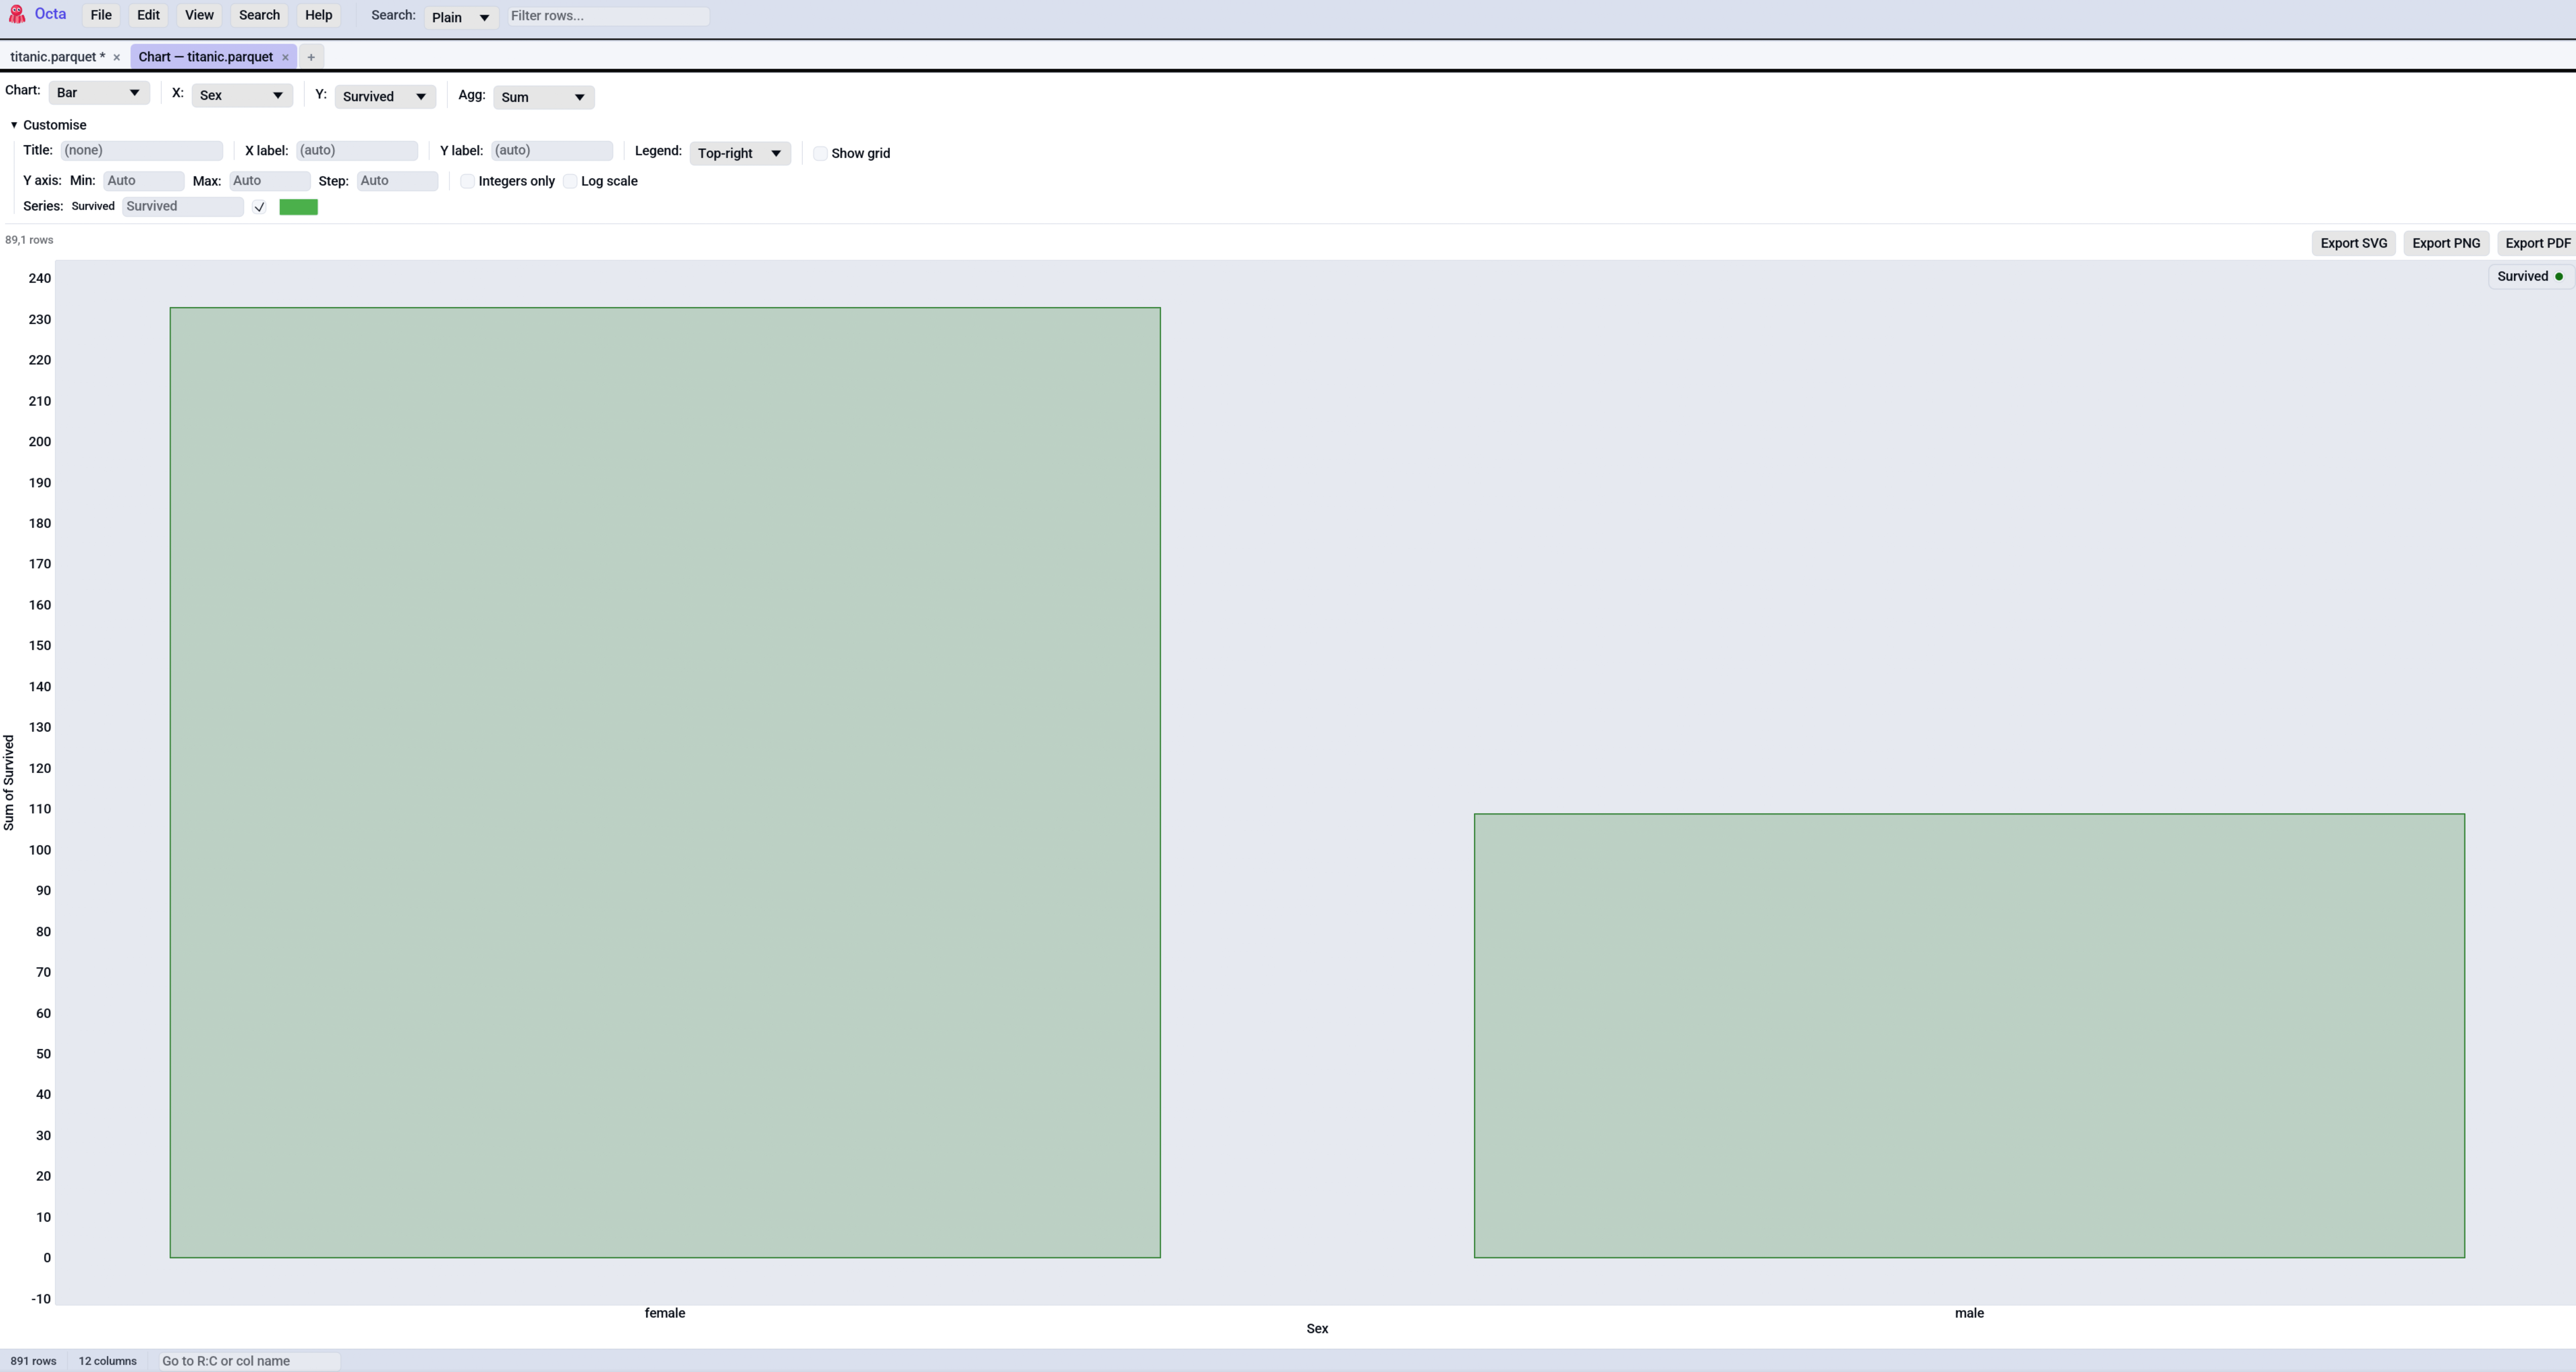
Each row is one job, with where to find it in the app, on the command line and as an MCP tool for AI agents. A dash means that surface does not offer it.
| I want to... | In the app | Command line | MCP tool |
|---|---|---|---|
| Summary statistics per column | Summary | --describe |
profile |
| Count values in a column | Value Frequency | - | value_frequency |
| Correlate numeric columns | Correlation | - | correlation |
| Time buckets and rolling windows | Time Series | --resample / --rolling |
resample_timeseries, rolling_window |
| Draw a chart | Chart | - | - |
| Show a trend and a forecast | Trend and forecast | --forecast |
forecast |
| Write an HTML report | Report | --report |
create_report |
| Look at a file's internals | File Internals | --describe |
describe_file |
| Find overlapping time spans | Timeline | --overlaps |
find_overlaps |